The heart of Reframe are databases which are called data frames. In this section, we will make sure you understand how to work with them.
At the end of this chapter you will know
🎯 how to create and set up your own data frame
🎯 how to fill in your data
🎯 how to review your data in the table view
🎯 how to connect several dataframes with each other
Introduction to data frames: Rows and columns #
Before we explain how to create your own data frame, let’s first look at how data frames are usually set up in Reframe. This will help you understand the basics.
If you want to start creating your own data frame right away, jump to section 4.2.
Like any other table, data frames in Reframe consist of rows and columns. In Reframe, columns are called fields. Rows are often also referred to as entries.
Fields define the overall structure of the table – they define what kind of attributes are stored for each data entry and in which data format they will be stored. Rows are the actual data entries and contain information for each entity that is stored.
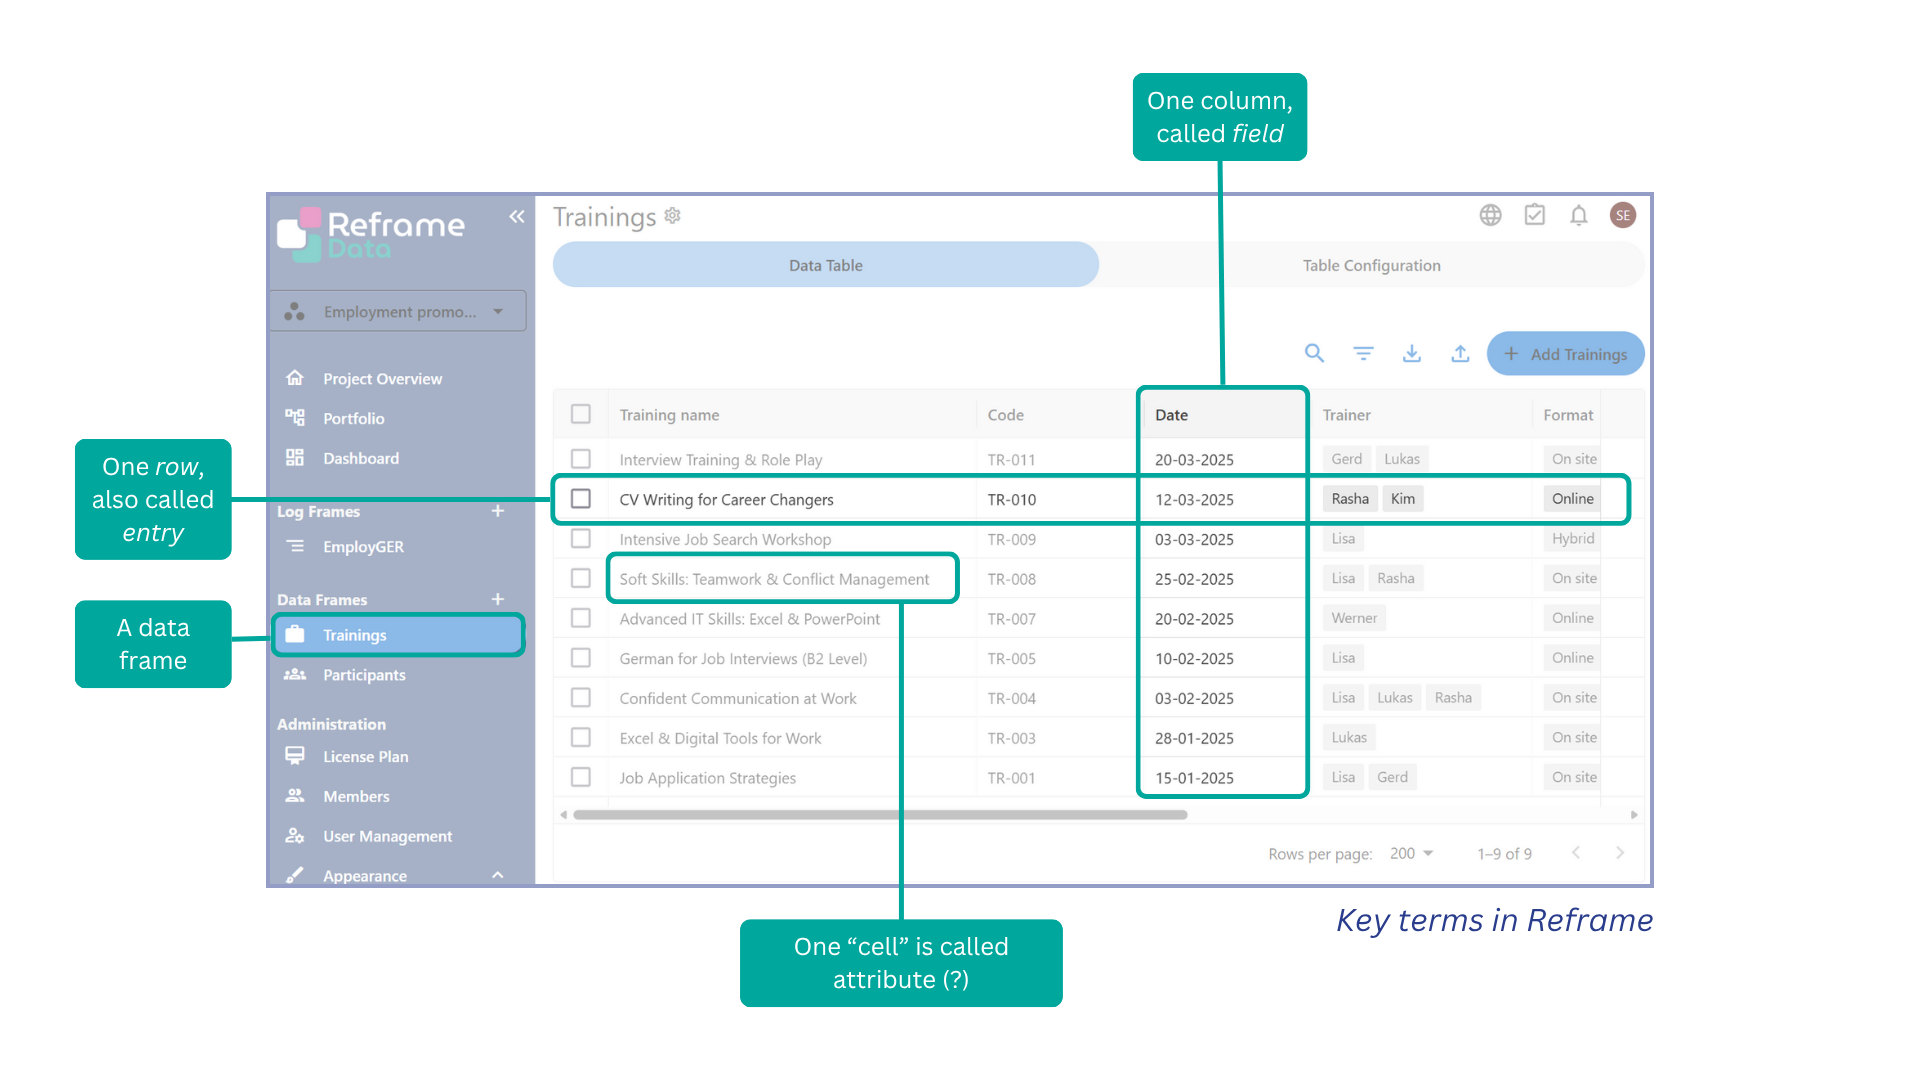
Whenever you open a data frame in Reframe, you will see that there are at least two tabs at the top: The Data Table tab and the Table Configuration tab. The Data Table tab displays all your data, while the Table Configuration tab enables you to customise your table’s structure.
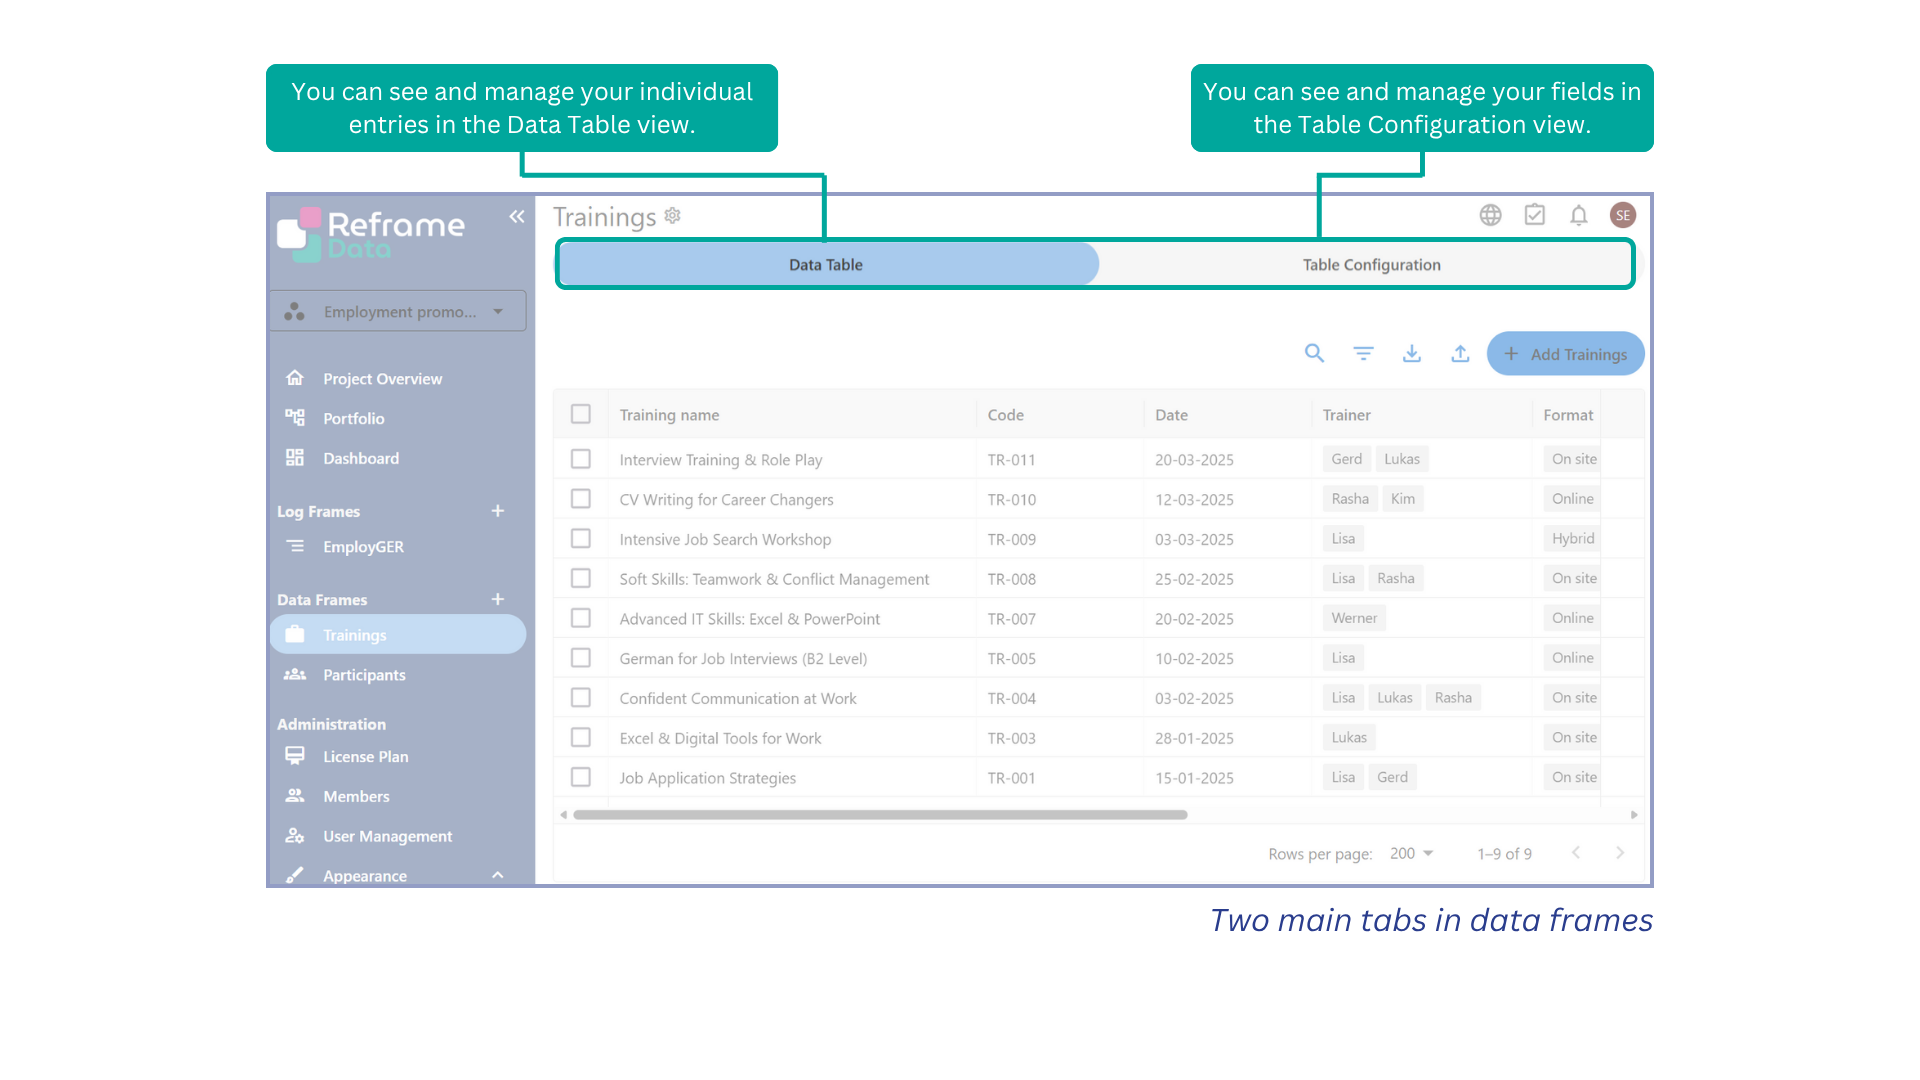
Table configuration #
Whenever you create a new data frame, you will start from an empty table that has no entries and only one field: the mandatory “Name” field.
→ To add more fields, you will need to navigate to the Table Configuration tab and click on “Add”. Then you need to choose the field type that you need.
[insert GIF adding a field type]
Field types #
Each field that you create will belong to a specific field type that you need to choose first.
Reframe currently offers 17 different field types. We will present these briefly in the table below. If you need more information on a particular field type, please follow the relevant link.
Icon | Field type | What it does | Best for |
|---|---|---|---|
Basic field types | |||
| Text | Single-line text | Titles, labels, short notes |
 | Long text | Multi-line text | Descriptions, comments, logs |
 | Number | Numeric value | Counts, measurements |
 | Currency | Numeric value formatted as money | Budgets, costs, prices |
 | Percentage | Numeric value presented as percentage | KPIs, completion rates |
 | Date | Calendar date | Deadlines, dates |
 | Choice | Single- or multi-select list | Categories, statuses
|
 | Yes/No | Yes/No field | Single-select with two fixed options |
 | File | General file upload | PDFs, docs, attachments |
 | Photo | Image upload | Visual documentation, images |
 | Hyperlink | URL link field | External references, websites |
 | Geo | Stores geographic location | Addresses, site locations May be displayed on a map |
Fields that link existing content with each other Please note that there is a whole section on connecting data frames. If you are unsure about these fields, consult this section first. | |||
Connection | Connects the DataFrame with other existing dataframes | Connecting existing information with each other & avoiding to collect the same data twice in different places | |
 | Incoming connection | Displays information | Explain here |
 | Lookup | Displays data from linked dataframes | Ensuring that referenced data updates automatically once it is changed in another DataFrame |
 | Indicator | Links to existing indicators in logframes | Showing how work affects metrics |
 | Project link | Links to existing projects | Connecting items to projects, good for cross-project referencing |
 | User | Field assigning one or more users | Ownership, responsibility |

Field properties #
Every field type has its own set of settings. But most fields share some basic settings which we will present here.
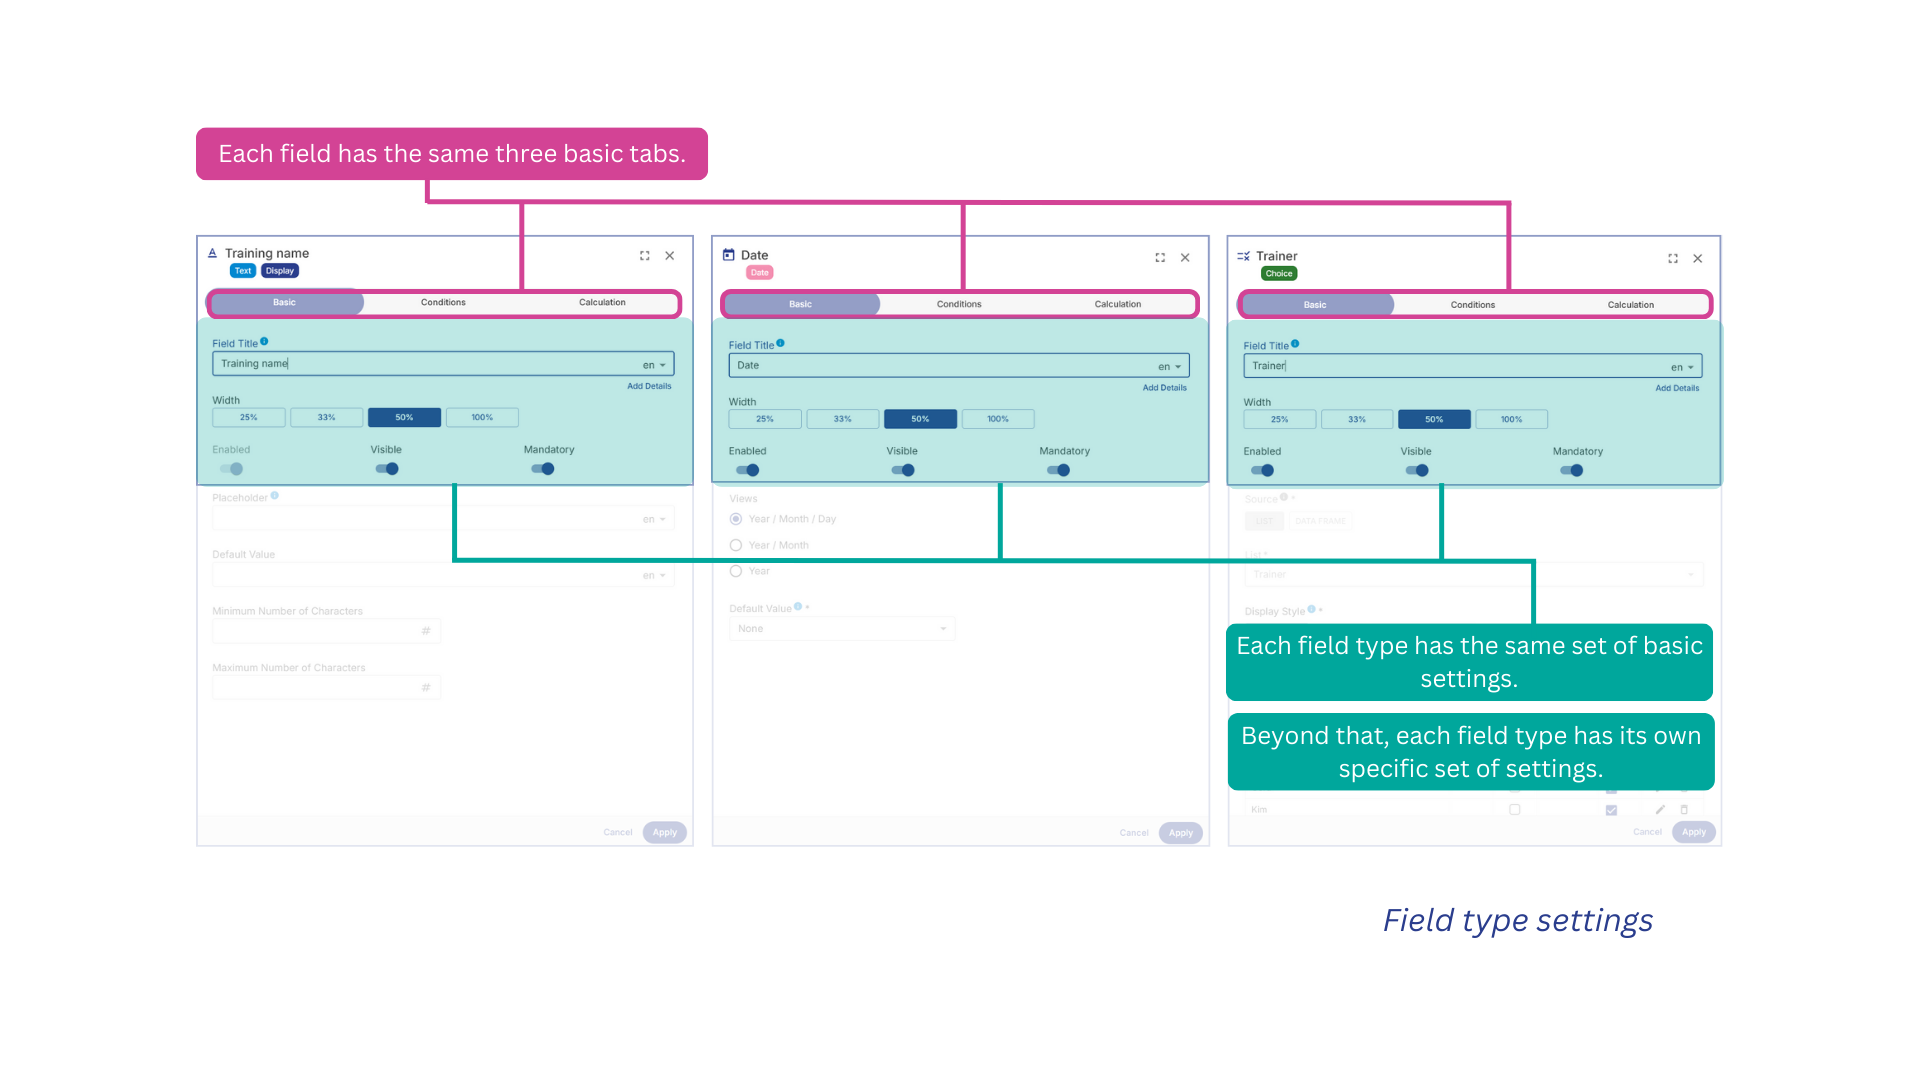
For each field, you can find three tabs that help you to set up
Basic
The essential information about your field, such as its name and fundamental settings.
Example: Name your field “Email Address” and choose whether it’s mandatory or optional.
Conditions
Define when or for whom the field will appear, based on certain criteria.
Example: Show the “Company Name” field only if the user selected “Business Owner” in a previous question.
Calculations
Set up automatic calculations for your field so it can display results dynamically.
Example: Create a field called “Total Earnings” that automatically sums the values of “Product Price” and “Amount sold”.
The Basic tab will help you set up the following dimensions for your question
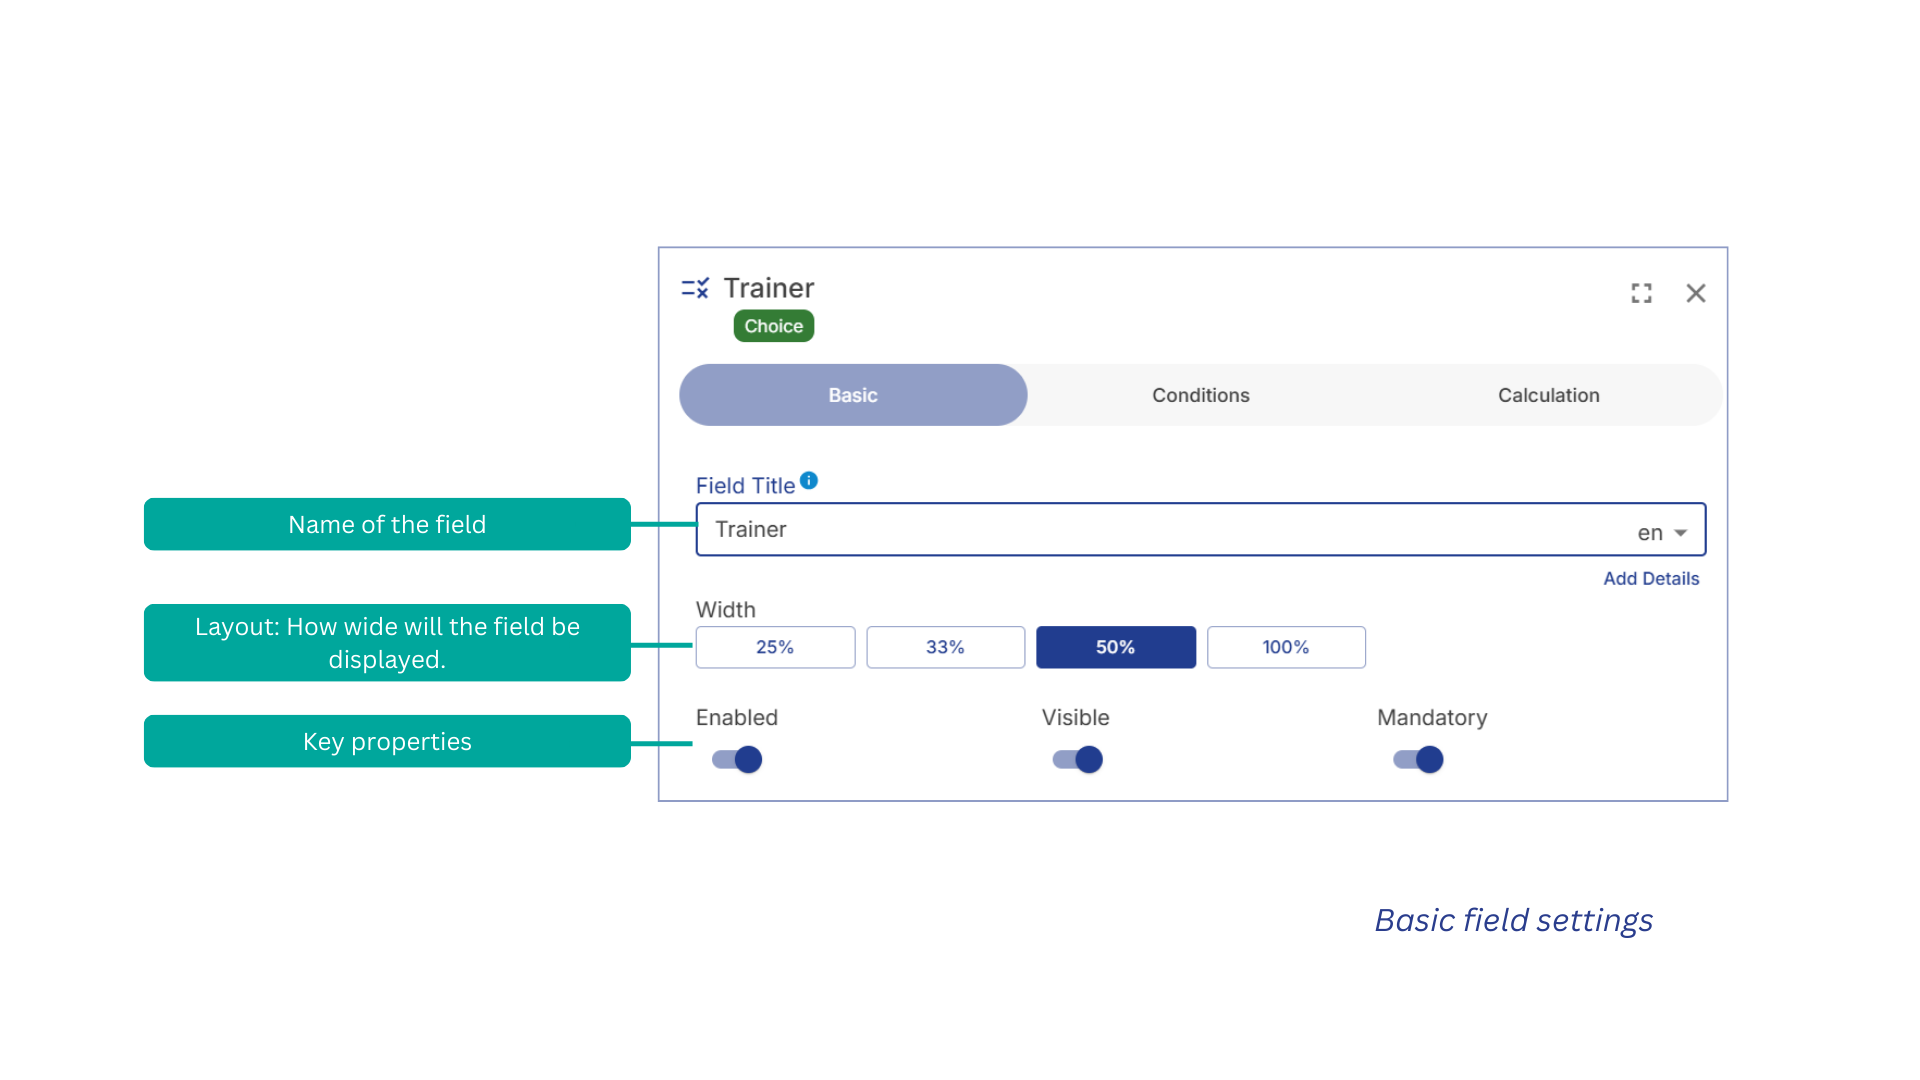
Field Title
→ What the field is called. This is the label users will see.
Width
→ How wide the field will appear on the page (e.g. 25%, 50%, 100%).
Key properties
→ Basic settings: Enabled = Turn the field on/off; Visible = Show or hide it; Mandatory = Make it required or optional.
We will discuss the Conditions and Calculations tabs in separate chapters. Please refer to these chapters directly if you want to learn more. Enter link.
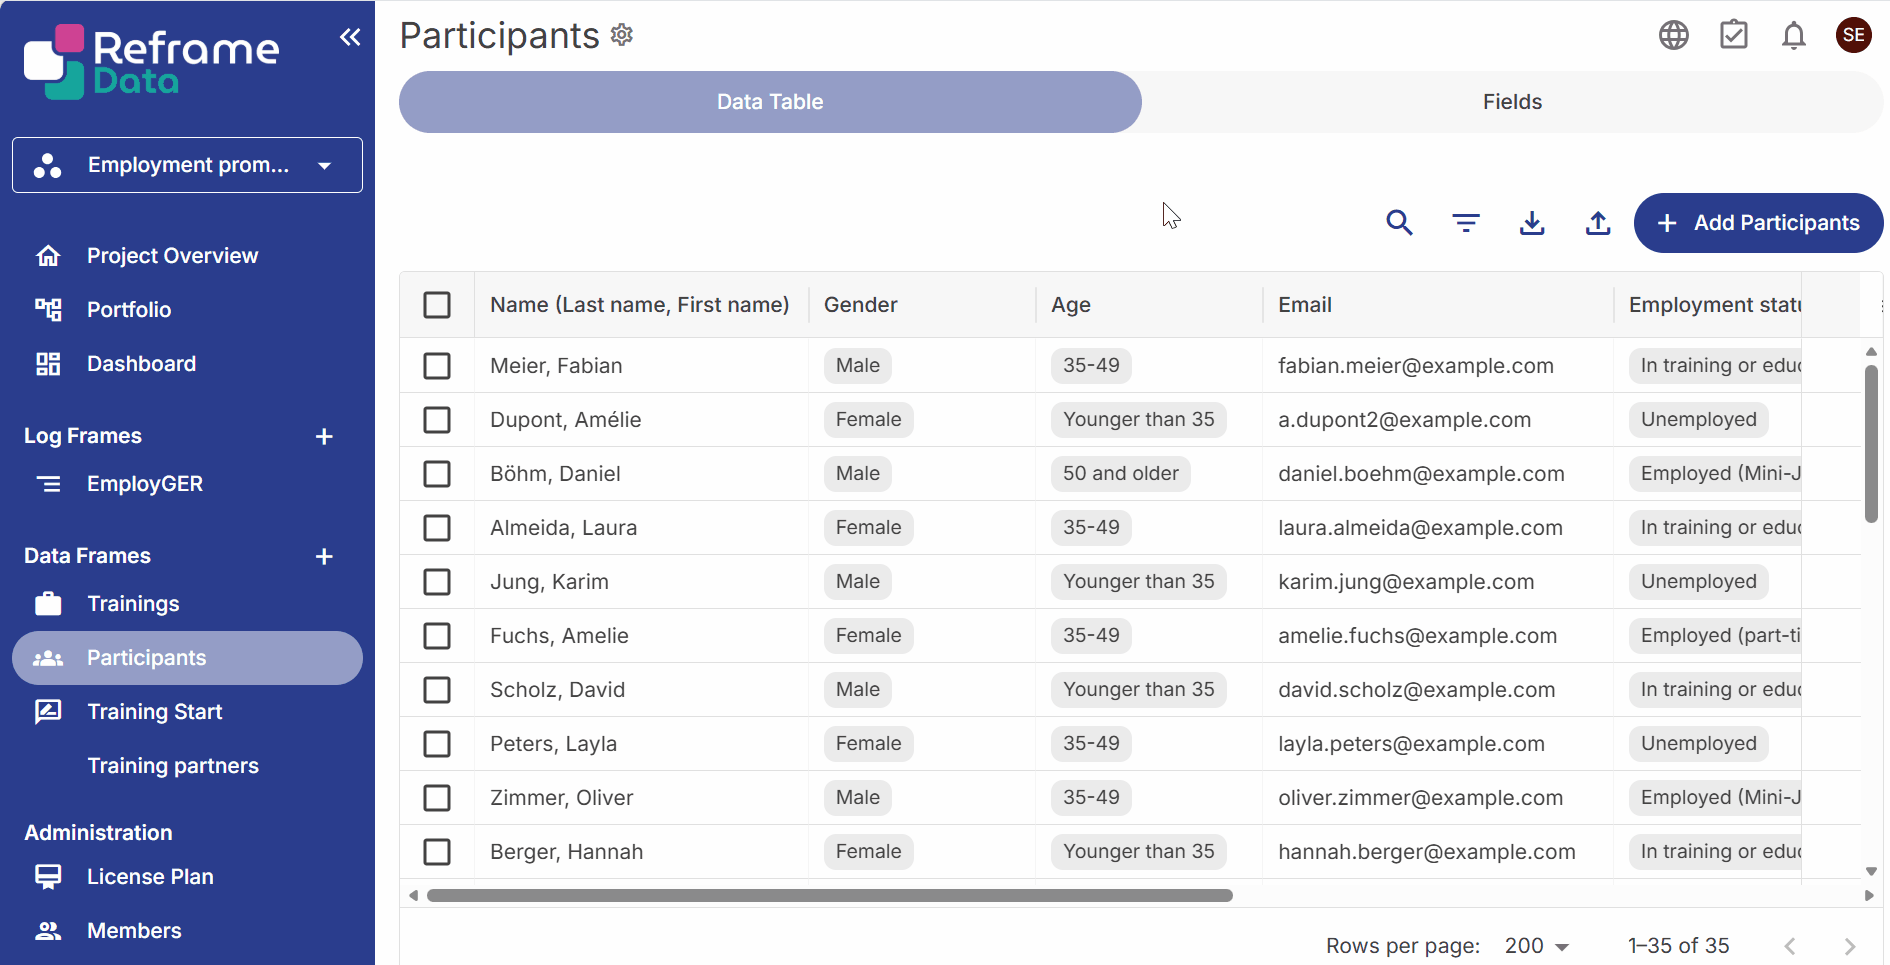
Entering data #
Once you have set up your table, it is time to fill it with data. Generally, there are three basic ways in which you (or your users) may enter data into your DataFrame:
Manually: You enter your data manually by creating a new entry and filling in the form one by one.
Via import: You enter your data into an Excel file that is then imported.
Via synchronization: You connect your DataFrame to an external source from which you will source your data.
Entering data manually #
If you want to enter data manually, you will always find a button at the top right of any DataFrame. This opens an interface called a drawer, where you can enter your information one by one.
Entering data via import #
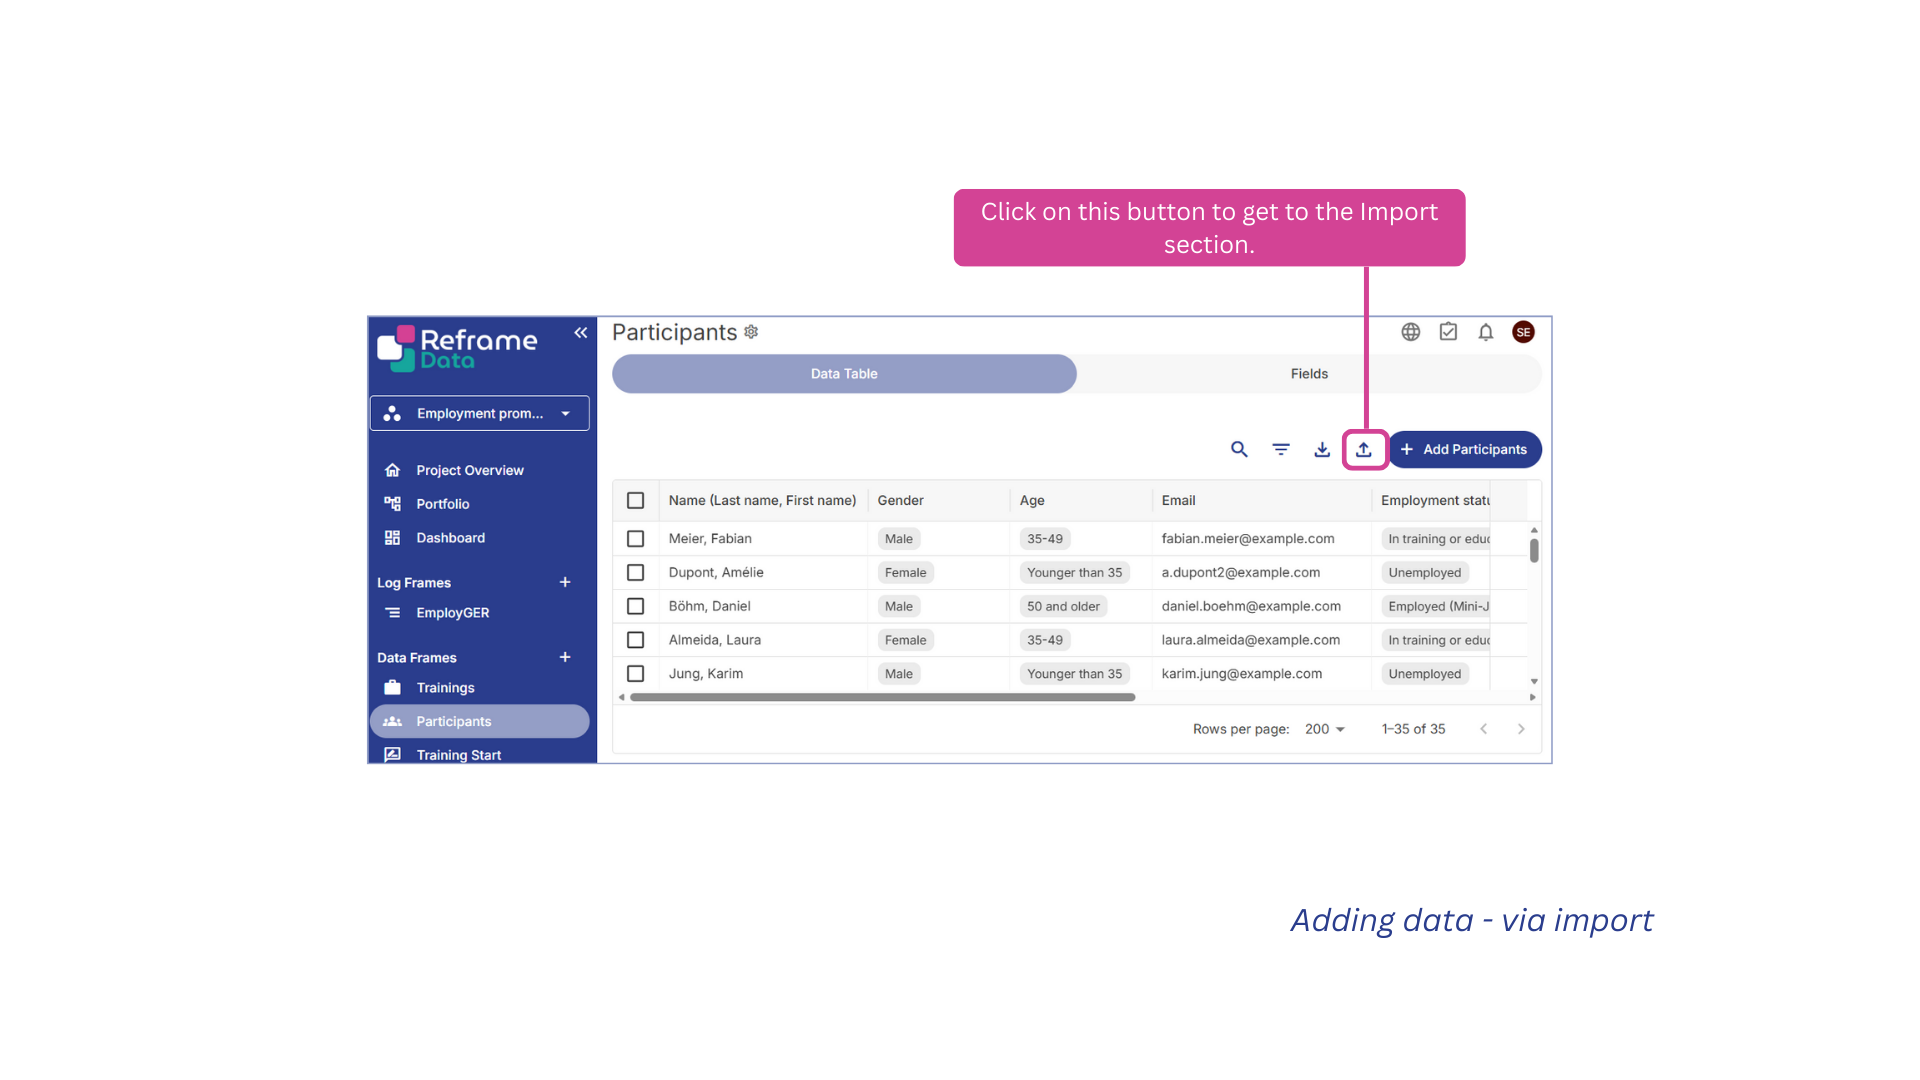
If you would prefer to collect your data externally, you can download an Excel template to fill in and then import back into Reframe.
The import process is one of the most complex within Reframe. That’s why we’ve created a short video covering the entire procedure. Feel free to watch it here. Create and link video.
Step 1: Downloading the Excel template
→ To do so, click on the ‘Import’ button and download the Excel template to complete it.
→ Watch how to download the template:
You will notice that the Excel file has the exact same fields (columns) as your DataFrame. The response options for multi-select fields will also be present.
Please note that Excel does not natively support multi-select fields. Therefore, any multi-select fields in your DataFrame will be converted to single-select fields in Excel.
Step 2: Filling in the Excel file
Step 3: Importing data
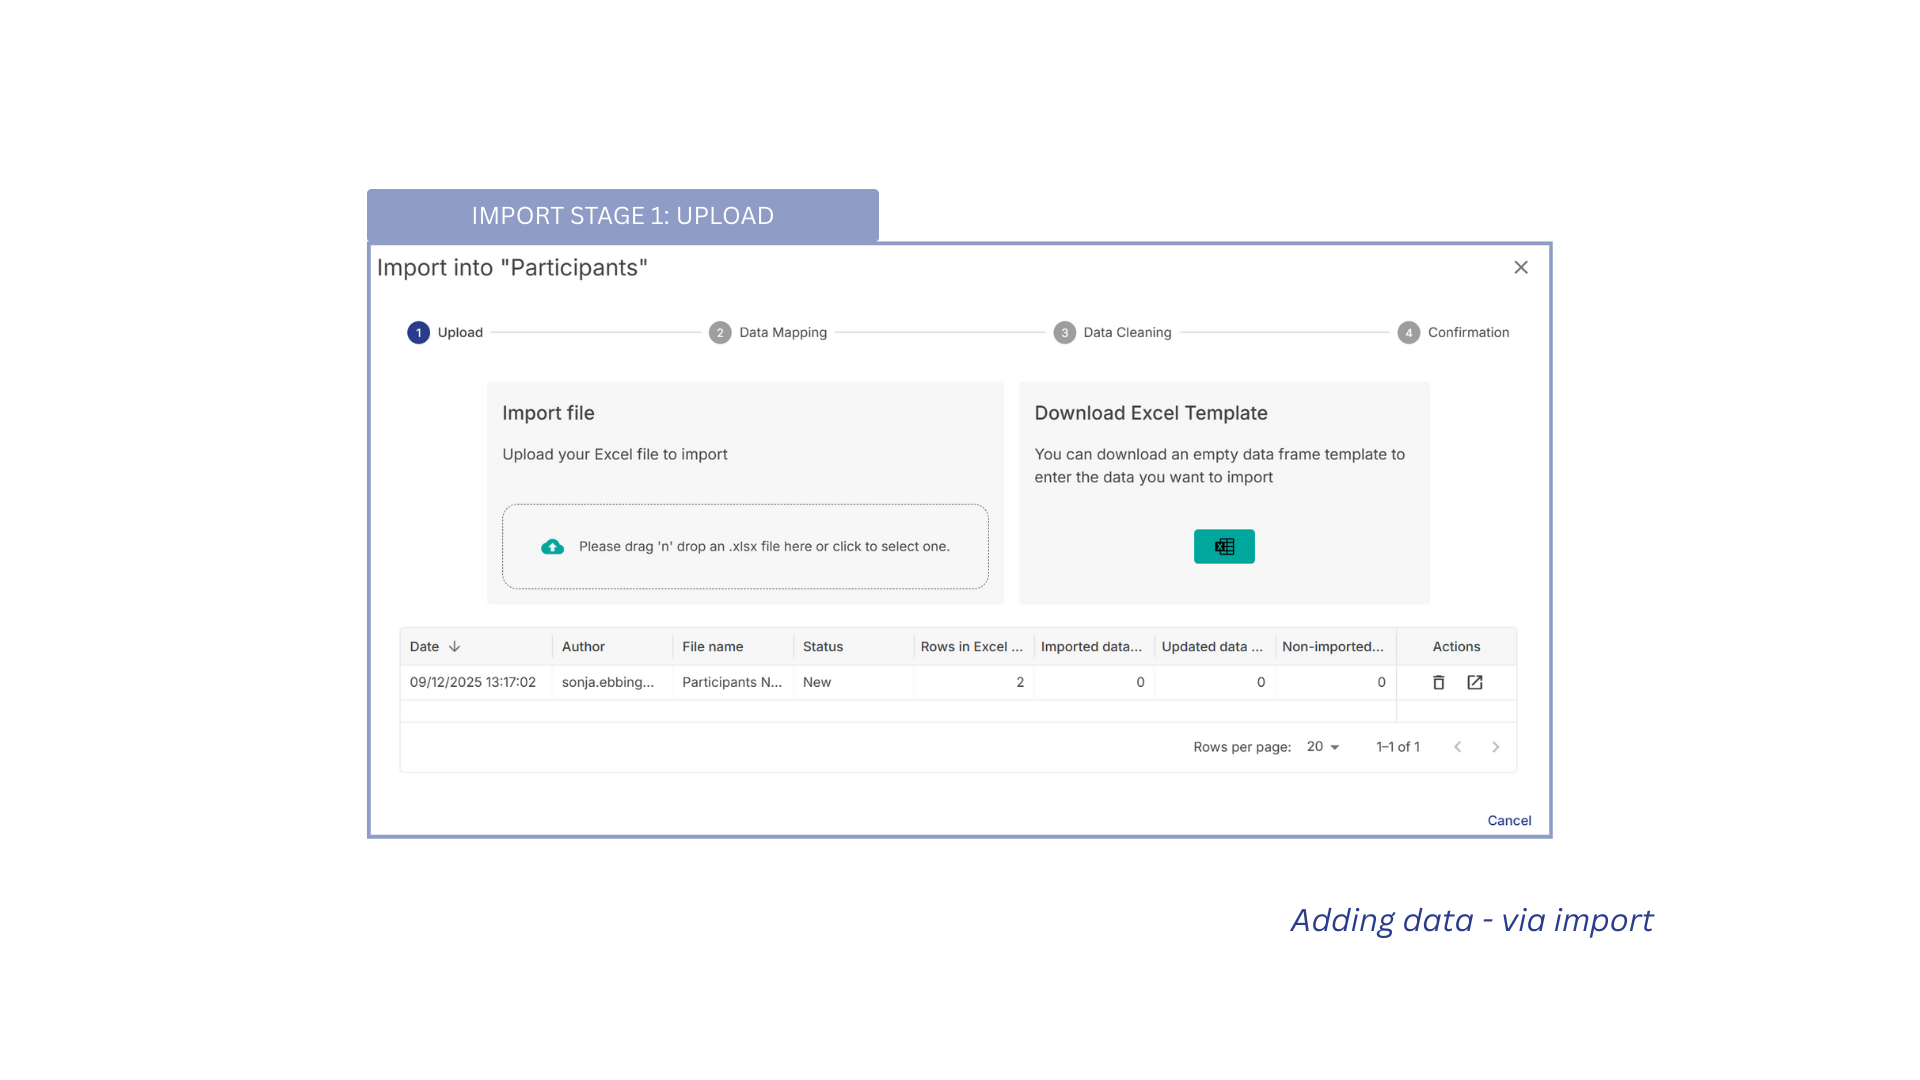
Once you have completed the Excel file, you can import it into your data frame in a few simple steps.
→ To start the import process, go to the ‘Import’ section again and either drag and drop your file into the ‘Upload’ section or open it manually by clicking on the section.
You will then be guided through a few stages to complete the import process.
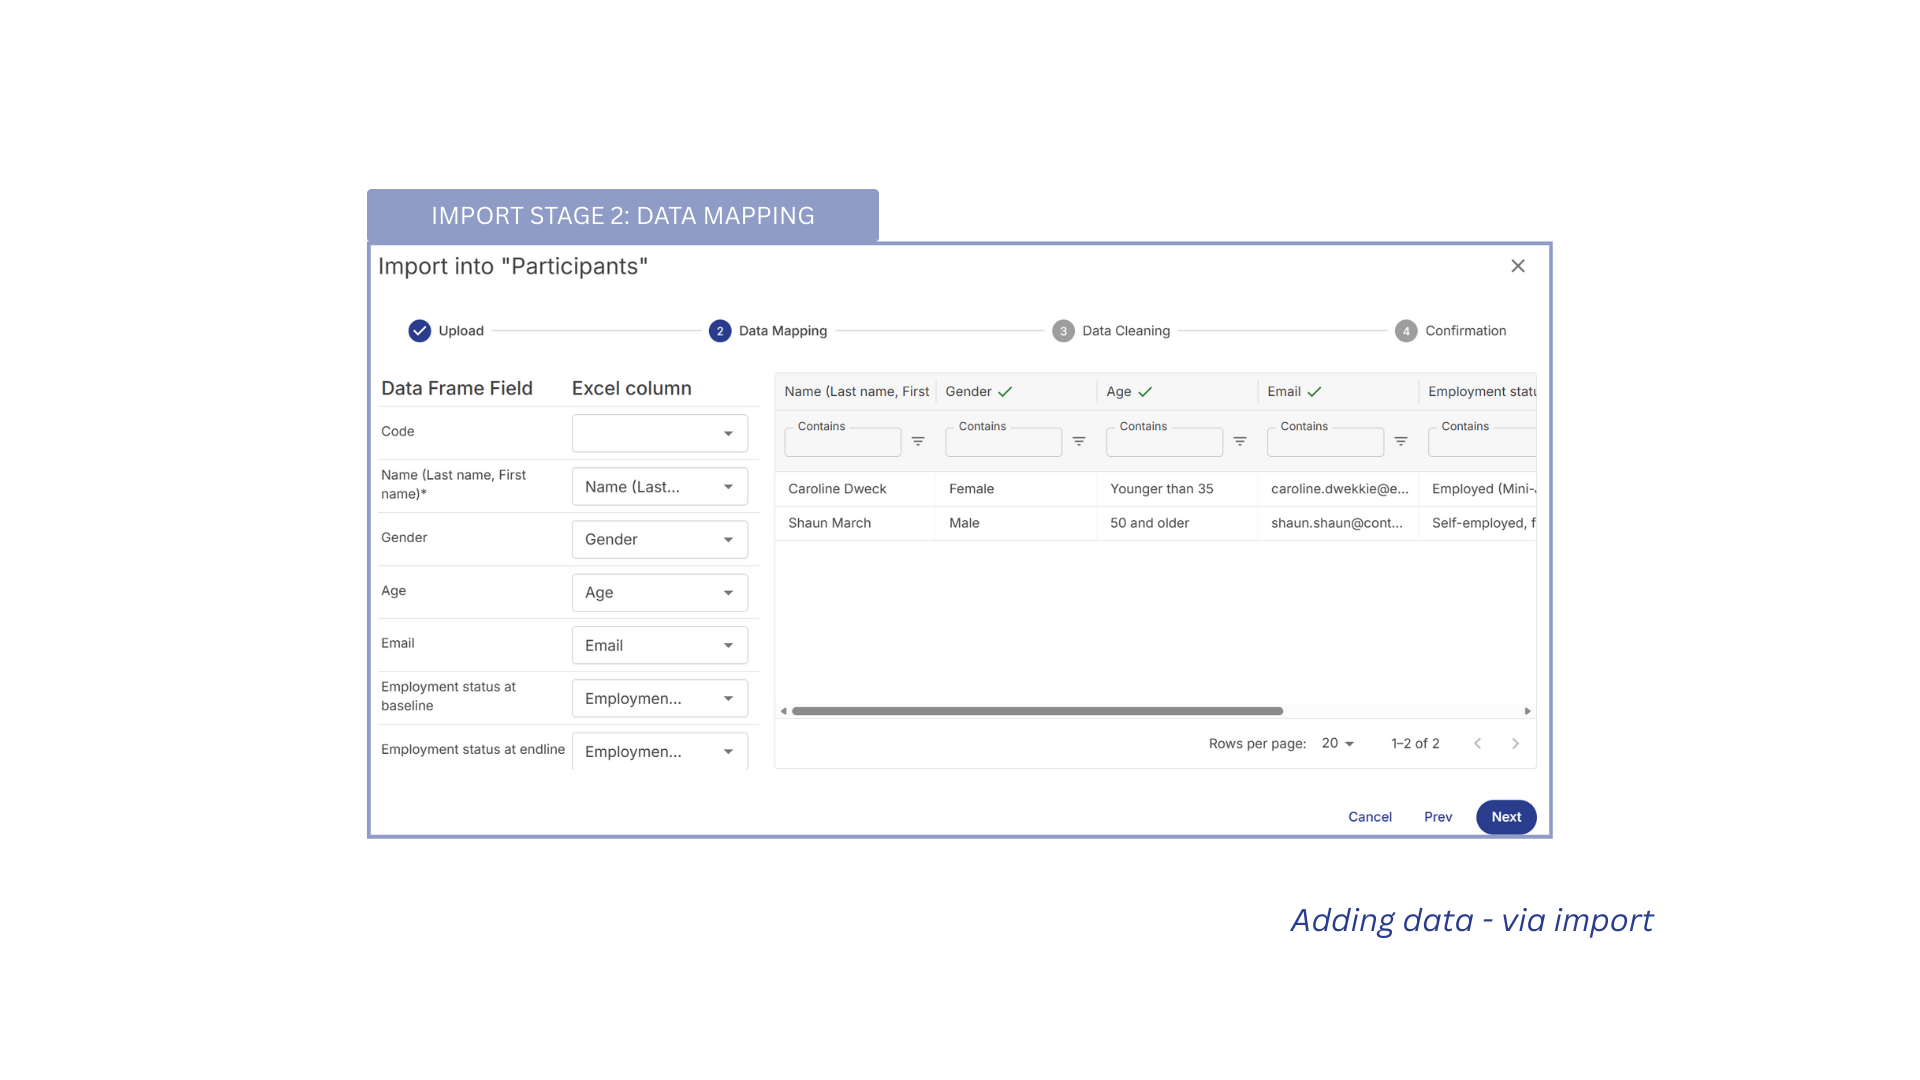
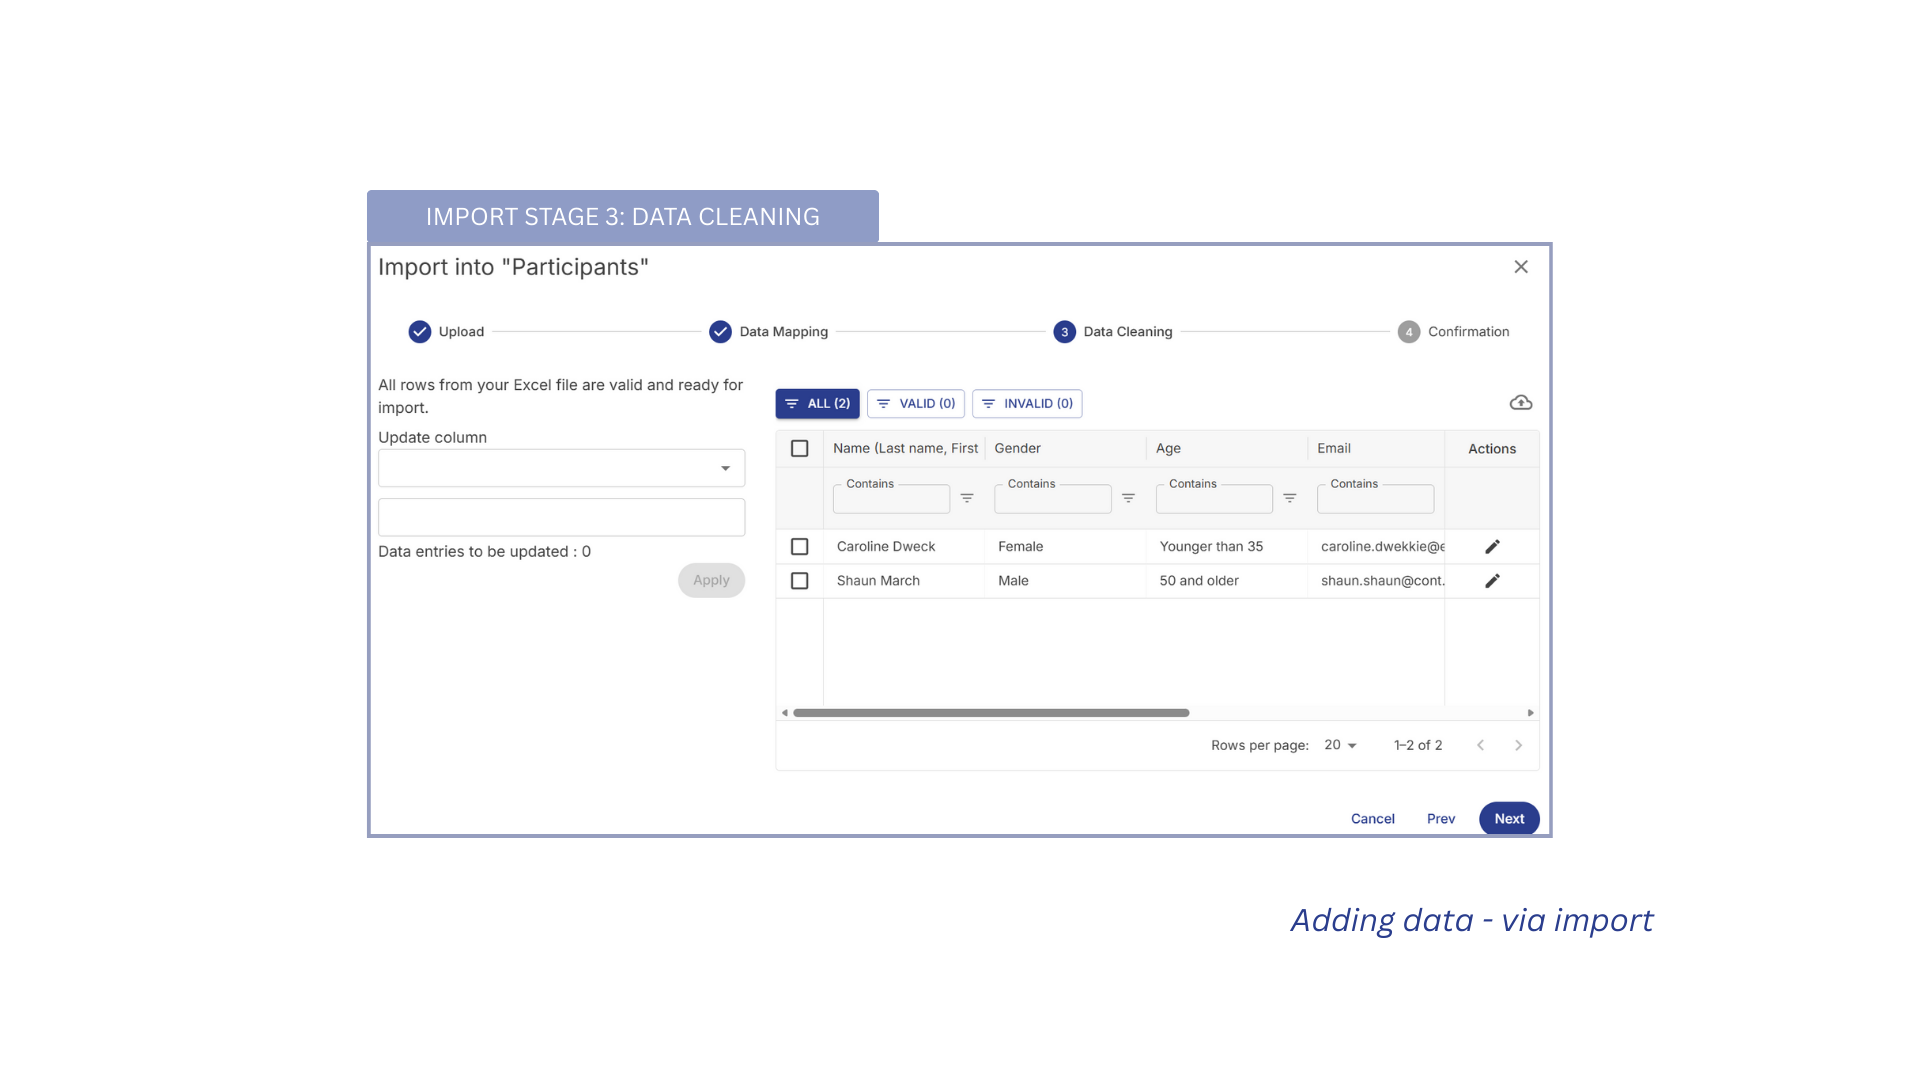
Import stages #
➡️ Stage 1: Upload. You completed the upload in the previous step.
➡️ Stage 2: Data mapping. At this stage, you will need to map the columns of your Excel table onto the fields that you have set up in Reframe. If you are using the Excel template provided by Reframe, this data mapping will usually be completed automatically and without issue. → Check whether the data mapping is correct and then click on NEXT to continue.
➡️ Stage 3: Data cleaning. Reframe will highlight any remaining issues at this stage (e.g. empty Excel cells belonging to mandatory Reframe fields) that need to be resolved before the import can be performed. You can make bulk changes or individual adjustments to your entries at this stage if necessary. → Check whether your data needs to be cleaned or updated, make the necessary changes and then click on NEXT to continue.
➡️ Stage 4: Confirmation. Here, Reframe asks you to confirm that all parameters are to your liking before you start the import process. → If you are happy with the preview, click on IMPORT to perform the import.
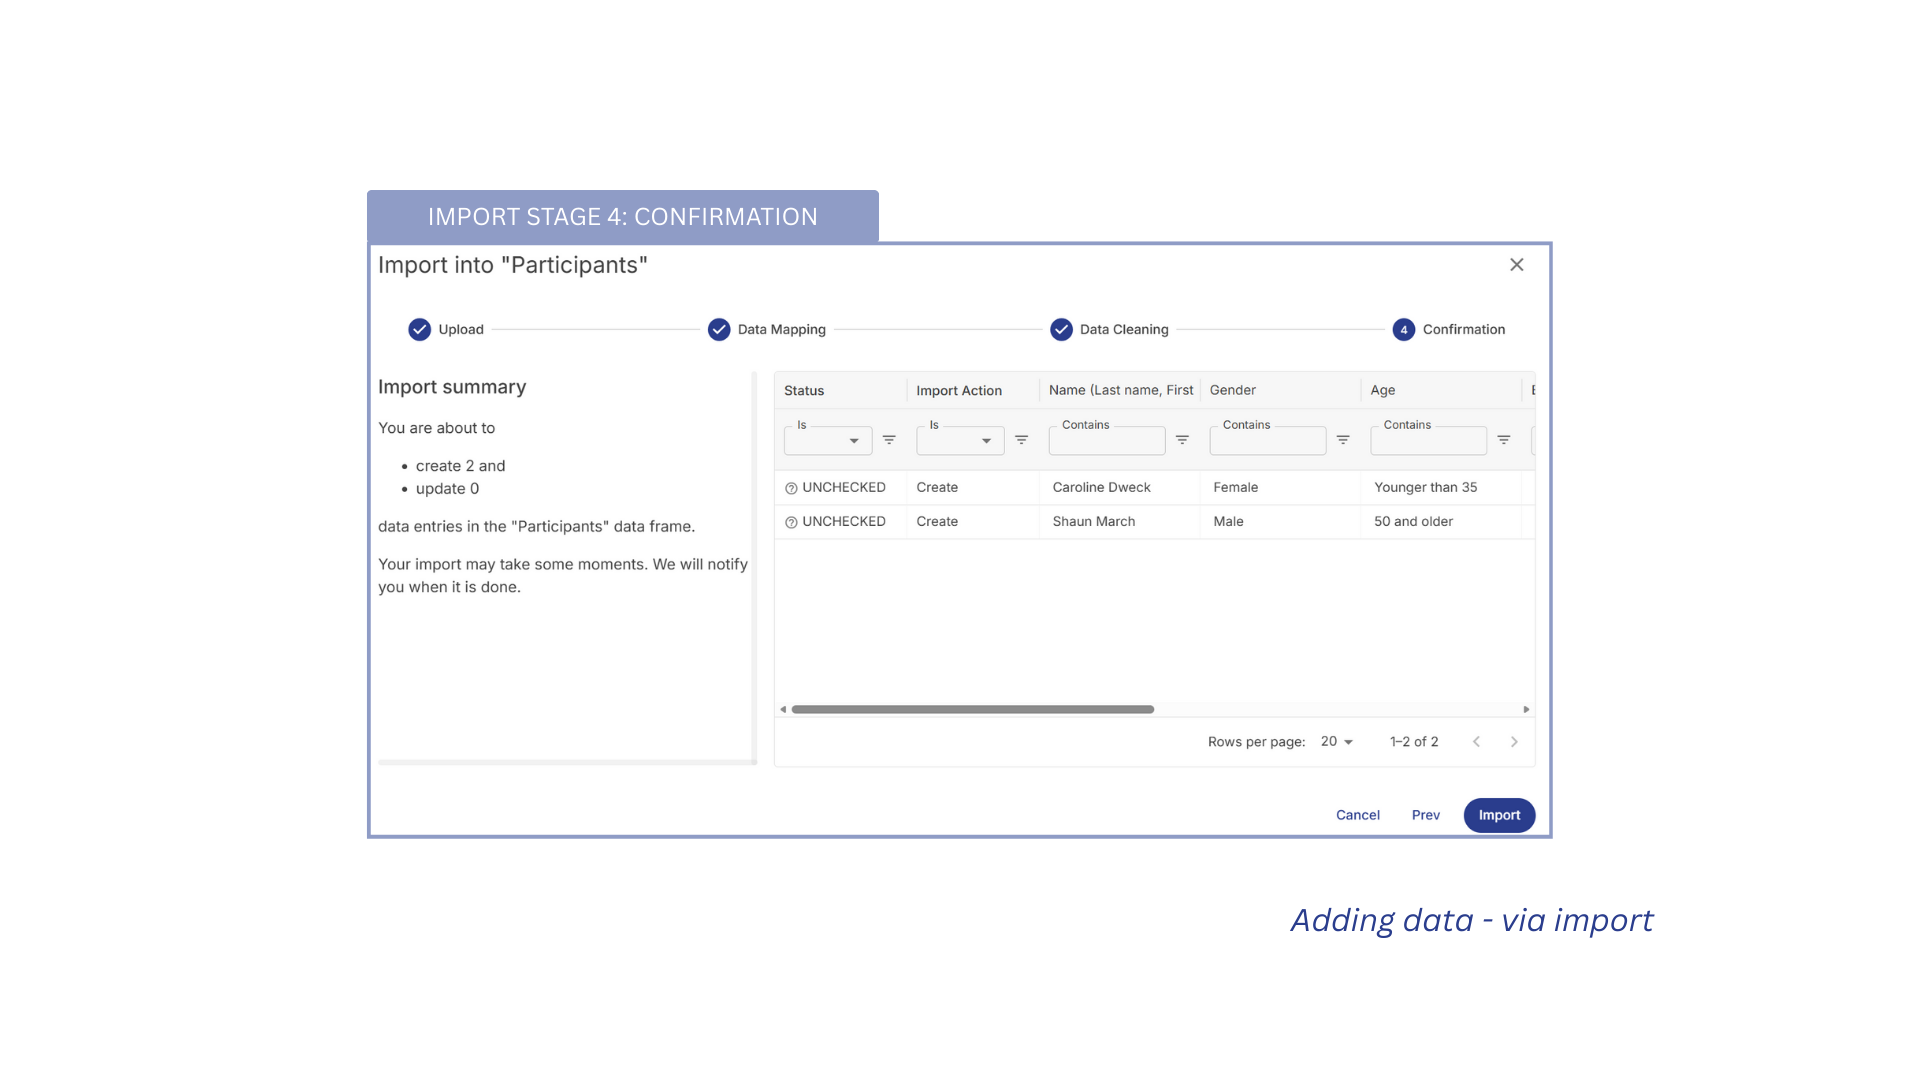
Throughout the four stages, you will see a table overview of the data to be imported on the right of the main window, as well as an area on the left for performing actions such as data mapping and edits.
Sometimes, issues may occur during the import process. Please refer to page 4.3.2, Importing data via import – Troubleshooting, to get help with solving them and completing your import seamlessly. Create and link page.
4.3.3 Entering data via synchronization #
In Reframe, there is a third option for adding data to dataframes: synchronising with an external data source. For example, you could synchronise with a live survey on Kobo Toolbox. To do so, you need to complete two crucial steps.
Connect Reframe to your Kobo toolbox account
Connect your Kobo survey to the relevant DataFrame
1. Connecting Reframe to your Kobo toolbox account #
First, you need to connect your general Kobo Toolbox account to Reframe. To do this, you will need to set up a ‘global’ connection between your account on the Kobo server and Reframe. Please note that this is only possible if you have account admin rights (create and link page to user roles) for this workspace.
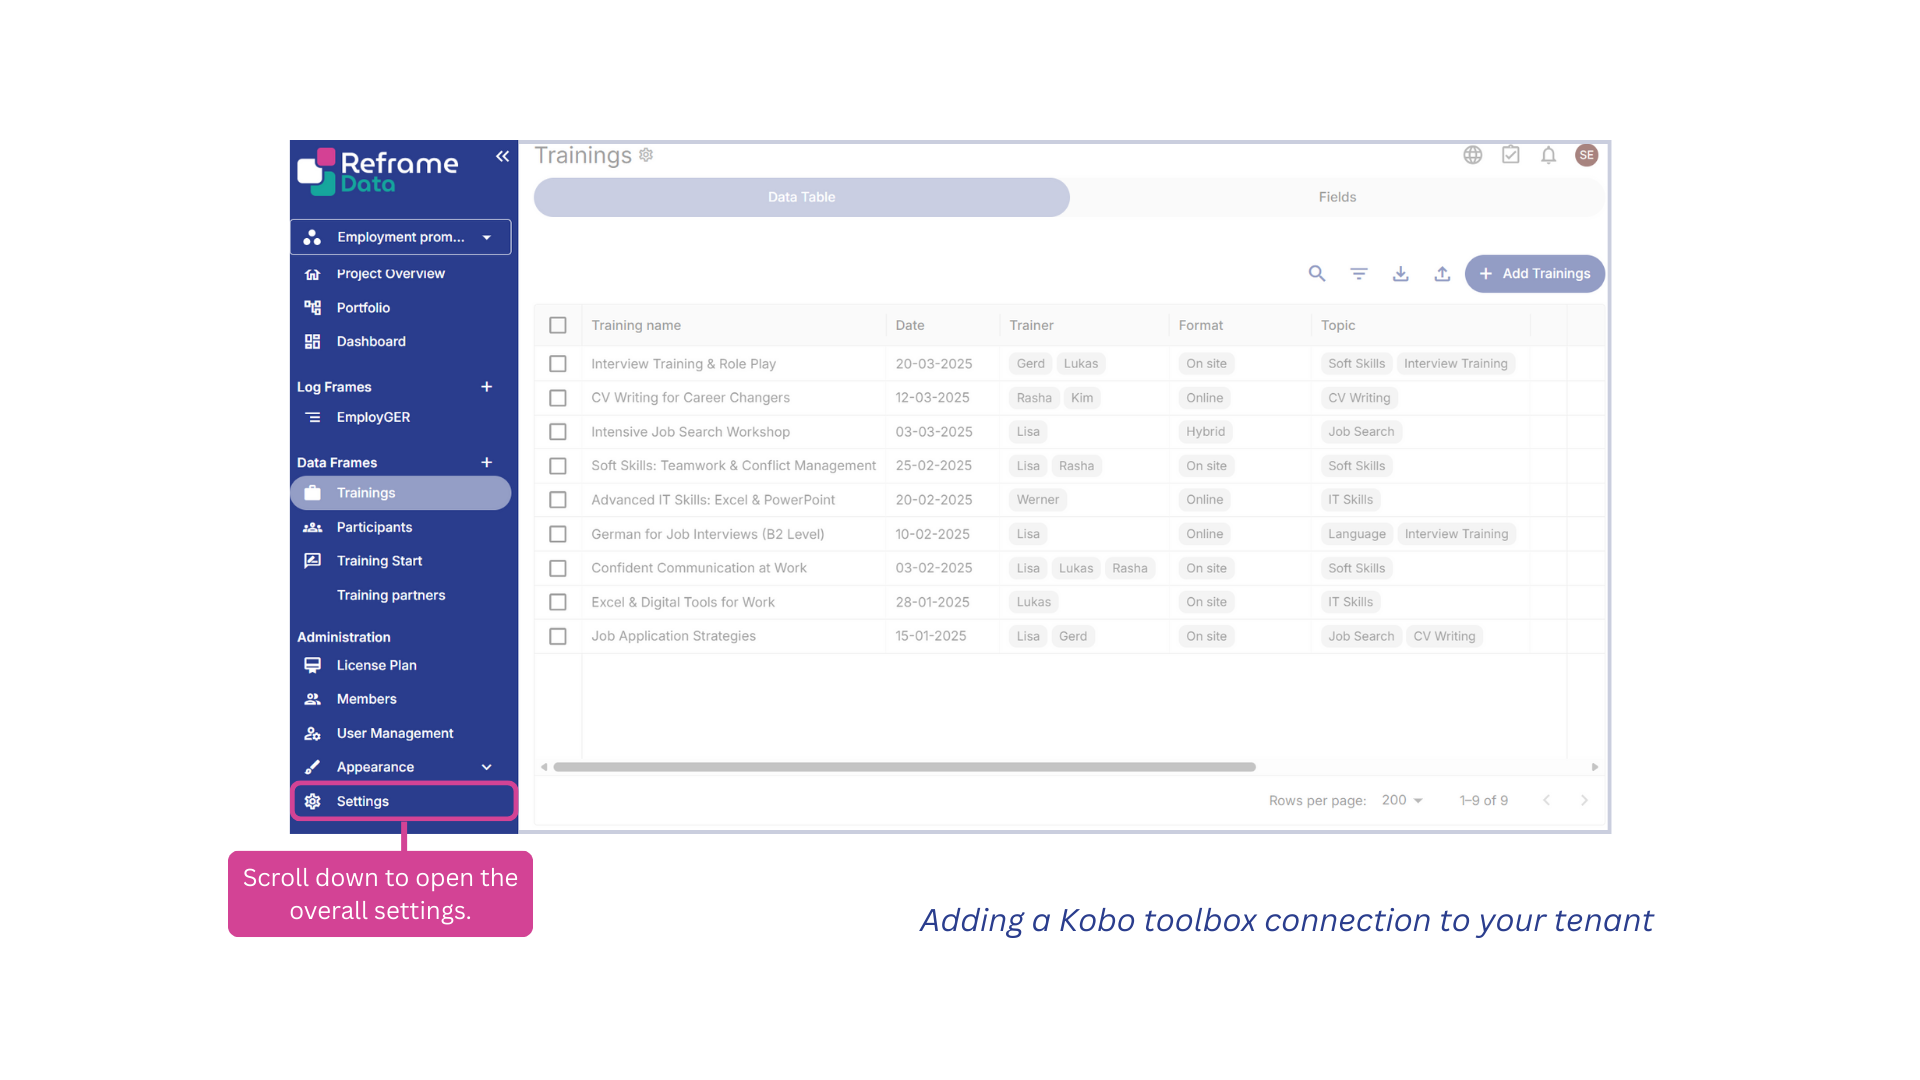
→ To do this, go to the general settings at the bottom of your navigation pane.
→ Once you are there, navigate to the INTEGRATIONS tab on the right.
→ Toggle on the field Kobo Toolbox. Then you will be able to add an account by clicking on + TOKEN.
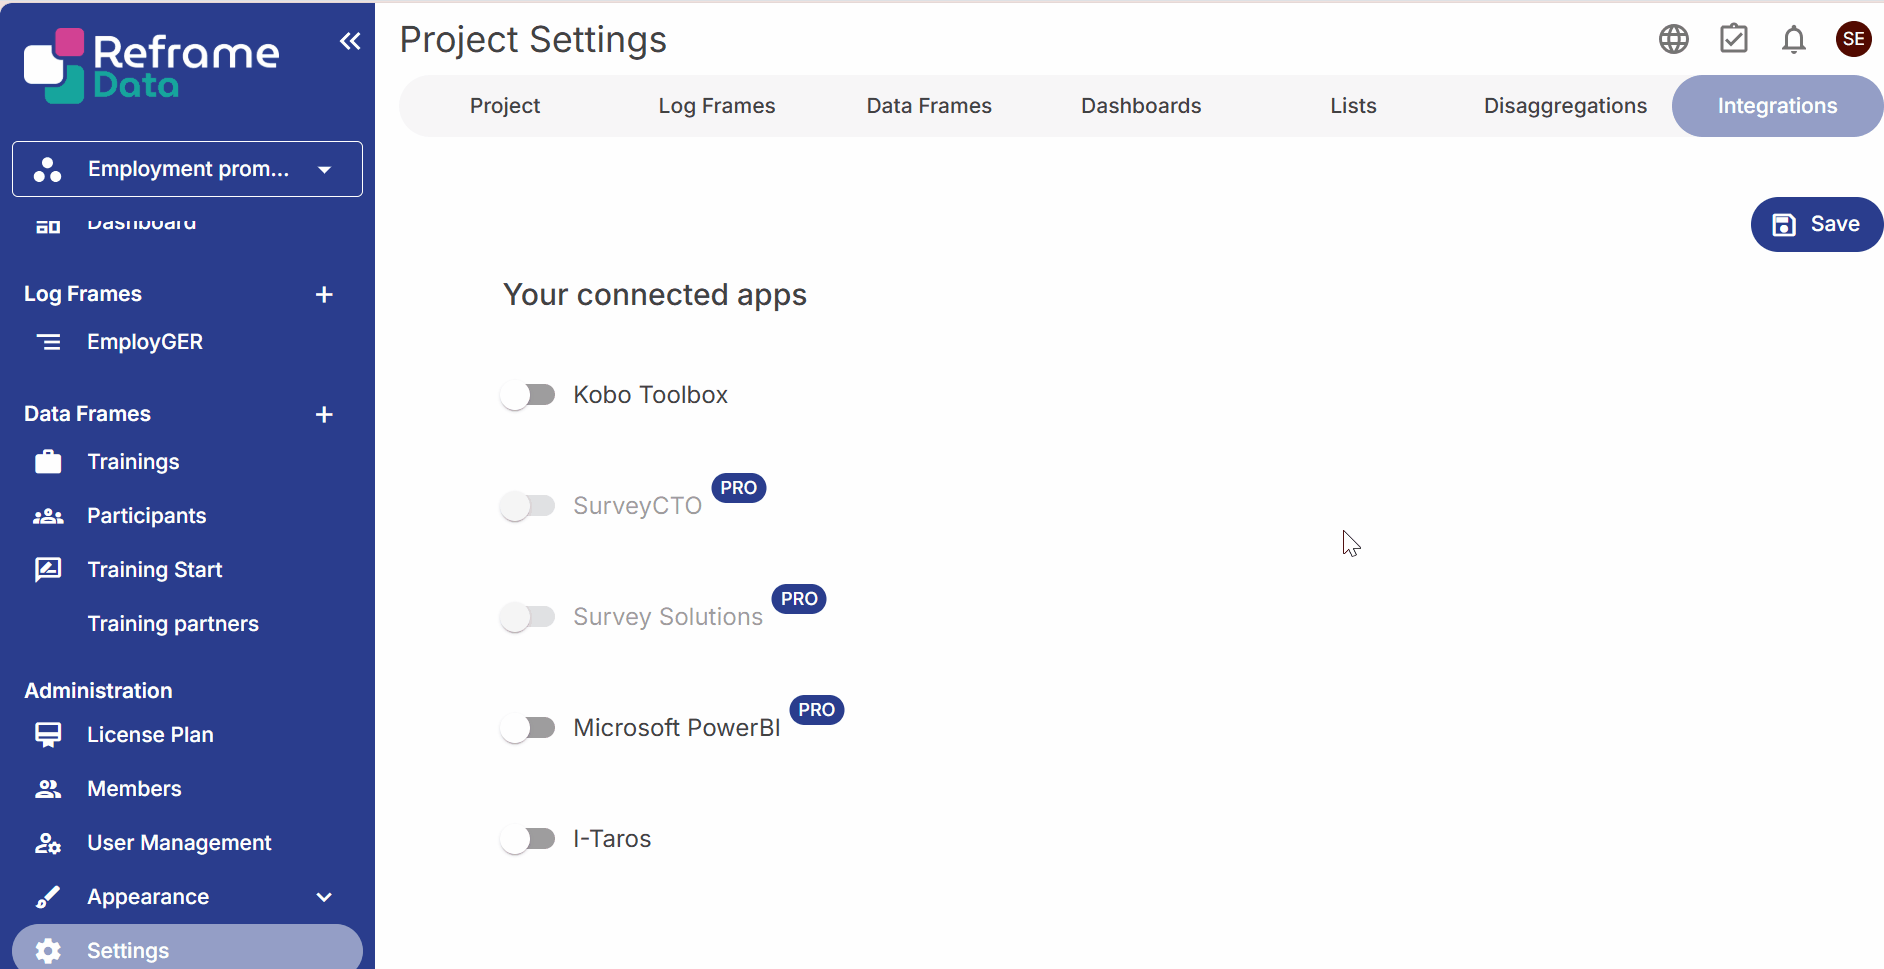
KoboToolbox URL: Enter the general URL of your relevant Kobo server here. Make sure you use the correct link (e.g. the EU server rather than the humanitarian server).
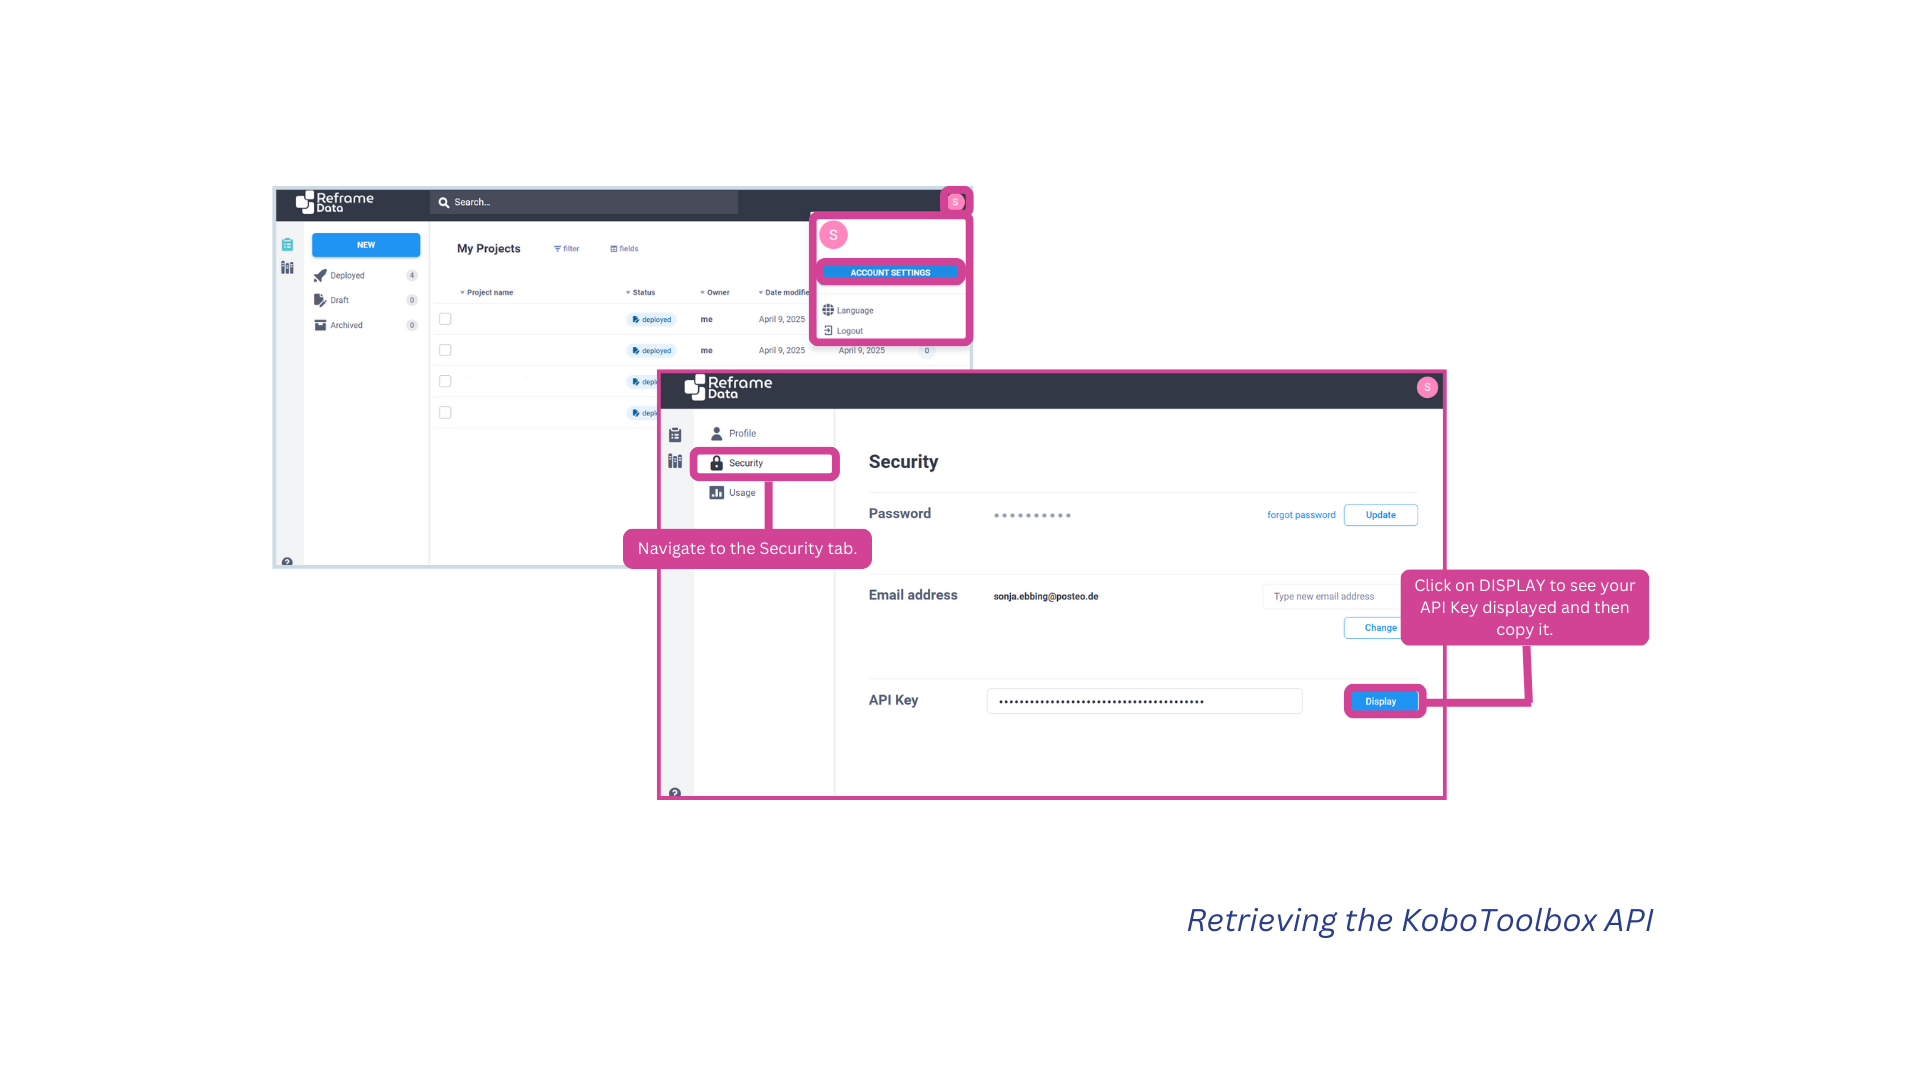
KoboToolbox Token: Each KoboToolbox account has its own API key, which we call Token. You can retrieve it when you log into your KoboToolbox account. → Please find instructions here: Getting started with the API — KoboToolbox documentation
→ Enter both the URL and the token, then click SAVE.
You have now successfully connected your Kobo account to Reframe. Please note that you need to add each KoboToolbox account individually, even if they are on the same server, as each account has its own API.
2. Connecting your Kobo survey to the relevant DataFrame #
Once your KoboToolbox account has been connected to Reframe, you can add all the surveys associated with that account to the relevant dataframes in Reframe.
Before setting up the connection, consider how well your Kobo survey and Reframe DataFrame match each other. The more similar they are, the more seamless the synchronisation will be.
Consider:
➡️ Which Kobo questions do you want to synchronise with Reframe?
➡️Are these questions of the same type (e.g. is my Kobo text field also a Reframe text field, or is it something else)?
➡️For select questions: Do they have the same response options?
It is important to think about these questions beforehand because you will have to perform datamapping for the synchronisation, which involves telling Reframe which question in the Kobo survey corresponds to which field in Reframe.